Navigating to Trade Page in the App. & how many Sections are there in Trade
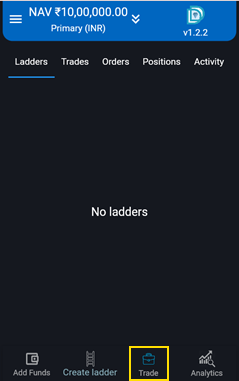
Trades Page can be found in the Bottom Navigation Bar.
There are 5 Sections in the Trades page and are displayed in the top. 5 Sections are as follows:
Ladders
Trades
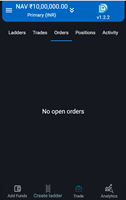
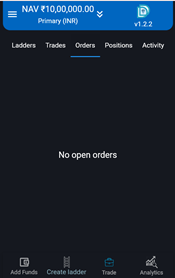
Orders
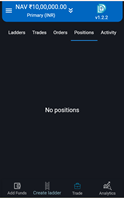
Positions
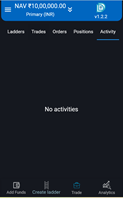
Activity
When the Ladders are not created, all the 5 Sections are shown blank with respective Notes- No Ladders, No Open Trades, No open Orders, No Positions and No Activities.
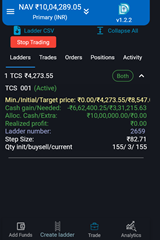
Let us observe what happens when we create a Ladder and the Ladder is saved. We can see in next page the details of the data displayed in the Trades Page. Please Note that only one Ladder has been saved (the Ladder has not been activated and also Trading has not been started) For detail procedure to create Ladder, please refer our separate document on how to create Ladder.
Line Items displayed on Saving the Ladder in Trades page
As soon as the Ladder is created and saved (the Ladder has not been activated and also Trading has not been started), we can observe in the 2 Sections viz Ladders and Activity that the data is automatically entered. The line items displayed are described below. Let us see what data has been displayed in Ladders and Activity.
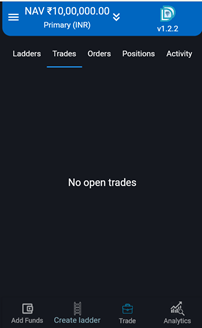
Please note that other 3 balance Sections viz. Trades, Orders and Positions are still blank.
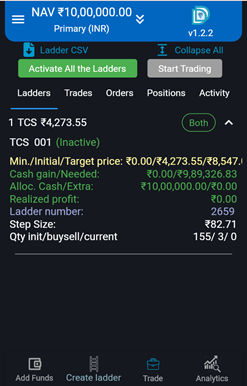
Details of Line Items displayed in Ladders Section: You can see Ladder for TCS stock is created for initial purchase price of Rs.4,273.55. This Ladder is serial numbered as 1 and is named as TCS 001 (Inactive). Since the Ladder has only been saved, (and the Ladder has not been activated and Trading not started) you will see the “Inactive” being displayed. Following information of the Ladder are also displayed:
a. Minimum price of stock configured Rs.0
b. Initial purchase price of stock Rs. 4,273.55
c. Target price of stock Rs.8547
d. Cash gain Rs.0
e. Cash needed Rs.9,89,326
f. Allocated cash Rs.10,00,000
g. Extra cash Rs.0
h. Realized Profit Rs.0
i. Ladder No. 2659. (a random Sr. No.)
j. Step size- Rs.82.71
k. Initial Buy Quantity of shares- 155 Nos.
l. Buy / Sell Quantity of shares- 3 Nos.
m. Current Buy / Sell Quantity of shares- 0 Nos.
You will observe that a filter is provided to view the Ladders in this Section and those are (Active, Inactive and Both). When there are multiple Ladders created, then using this filter- feature, specific Ladder details can be searched.
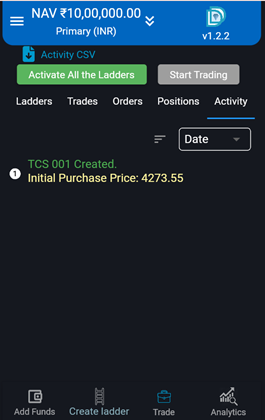
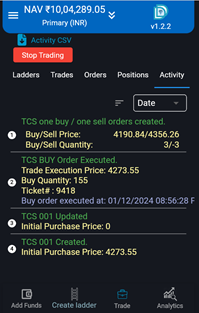
Details of Line Items displayed in Activity Section:
You can see the details displayed about Ladder for TCS stock, in Activity section.
There is only one entry.
TCS 001 is created at the initial purchase price of Rs.4,273.
Please Note and observe that other 3 Sections- Trades, Orders and Positions are blank. Let us understand what additional data are displayed after the Ladder is Activated and Trading is started. Let us quickly revise how the Ladder is to be activated and thereafter to Start Trading. Detail procedure on Creating the Ladder may please be referred for elaborate description.
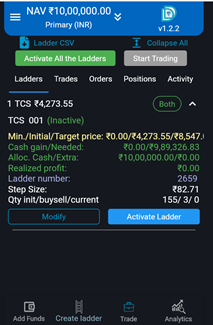
How to Activate the saved Ladder.
In all the 5 sections of Trades page you can observe at the top portion the buttons- “Activate all the Ladders” and another button “Start Trading”.
Also when you click anywhere in the 1 TCS ladder data section, two additional buttons can be observed at the bottom of the screen- “Modify” & “Activate Ladder”.
Depending on your desire to activate this particular ladder or all ladders you can use the button “Activate ladder” or “Activate all the Ladders” button respectively.
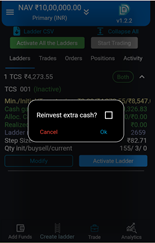
On activating the Ladder Button, following Dialogue box will appear. User needs to select the Option of reinvestment of extra cash criteria. Detail description on this option is explained in a Separate Document- “Information document on Creating Ladder”.
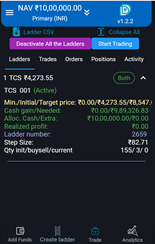
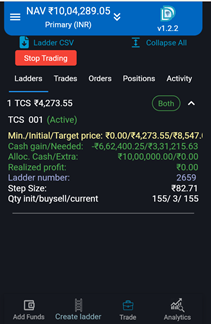
On successful activation of the Ladder, the colour of the top two buttons changes and the description of the first Button (“Activate all the Ladders”) is also changed to “Deactivate all the Ladders”. Start Trading Button is now in enable mode.
User need to click Start Trading.
On successful completion of start trading, both the buttons on the top (“Activate all the Ladders” and another button “Start Trading”) disappear, and new button “Stop Trading” appears. All the screen shots are pasted above for easy understanding.
By using the Start Trading button mentioned above, all the Ladders which are activated begins to start trading.
If User wishes to activate only a specific Ladder the procedure is as follows. As you click on details of the Ladder (which is inactive), new buttons are displayed at the bottom of the Ladder details. They are “Modify” and “Activate Ladder”. By clicking on this Activate Ladder that specific Ladder gets activated. All other Ladders are in their original position.
In front of the Ladder name, active / inactive status of the Ladder is displayed. Please note the status changes as you initiate the Activate Ladder button.
User when he creates a new additional ladder. And the old ladder is already active, and in trading mode. During this scenario, when the new ladder is activated and trading needs to be started, he has to first do stop trading by clicking Stop Trading button. After this, Start Trading button has to be clicked. By doing so, all the active ladders start trading.
Additional data displayed after Activating the Ladder and Start Trading:
Let us observe in detail what changes has been displayed in the 5 Sections one by one before and after activating the Ladder.
4A. Ladders Section:
After activating the Ladder and Start Trading, you will observe from the two screens that following data has changed
a. Cash gain Earlier was Rs.0 and now it is -Rs6,62,400 (4273.55*155) (Initial purchase price of stock * Initial Buy Quantity of shares)
Cash needed was Rs.9,89,326 and now it is Rs.3,31,215 (989326-662400)
Current Buy / Sell Quantity of shares- 0 Nos an after start trading it is 155
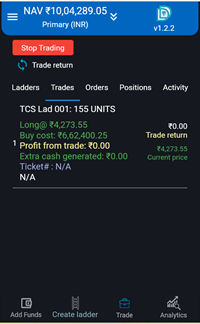
4B. Trades Section:
There was no data in the Trades Section and now additional data is displayed, the details of which are listed:
TCS ladder 001 is created with purchase of 155 shares.
The trade executed is long and unit purchase price is Rs.4273.55.
The total buy cost is Rs.6,62,400 (4273.55*155) (Initial purchase price of stock * Initial Buy Quantity of shares)
Profit from Trade is Rs.0
Extra cash generated is Rs.0
Trade Return is Rs.0
Current Share price is Rs.4273.55
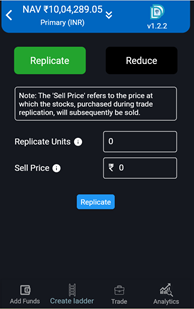
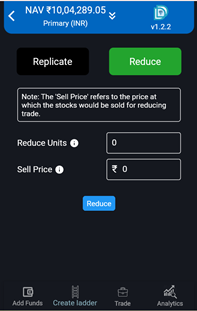
When you click anywhere on the data section of TCS, you will find an additional button “Replicate or Reduce” button appearing at the bottom of the screen.
4C. Trades Section: “Replicate or Reduce button”
Following two options appear to the User when he clicks this button:
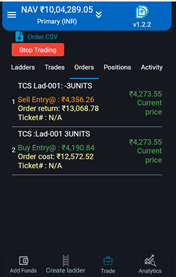
4D. Orders Section:
There was no data in the Orders Section and now additional data is displayed, the details of which are listed:
a. A pair of Buy and Sell orders are placed after execution of every Trade.
As soon as any of the order is executed the other order gets cancelled and a new buy sell order is placed depending upon the position we are in the Price ladder.
Since the current price of stock is Rs.4273.55, a sell order is placed when stock price reaches (current price + step size) ie (4273.55 +82.71= 4356.26)
Similarly, a buy order is executed when stock price reaches (current price – step size) ie (4273.55 -82.71= 4190.84)
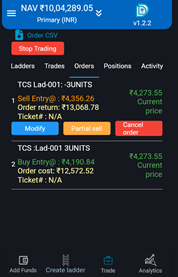
When you click anywhere on the data section of TCS Sell Entry, you will find 3 additional buttons appearing on the screen “Modify”, “Partial Sell” and “Cancel Order”.
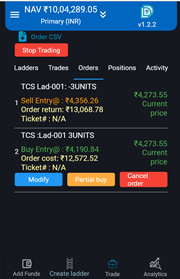
Similarly when you click anywhere on the data section of TCS Buy Entry, you will find 3 additional buttons appearing on the screen “Modify”, “Partial Buy” and “Cancel Order
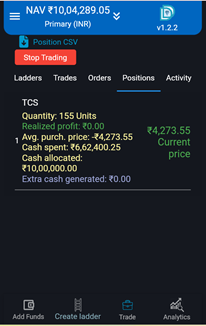
4E: Positions section:
There was no data in the Positions Section and now additional data is displayed, the details of which are listed:
Quantity of shares bought: 155 Nos.
Realized Profit: Rs.0
Average purchase price: Rs.4273.55
Cash spent: Rs.6,62,400.25
Cash allocated: Rs.10,00,000
Extra Cash generated: Rs.0
Current share price: Rs.4273.55
When you click anywhere on the data section of TCS, you will find 2 additional buttons appearing on the screen “Close Position” and “Cancel”
4F. Activity section:
Difference in data displayed in Section- Trades & Positions
5A: The displayed data in Trades and positions sections for one Ladder are compared below: 5B:
Modify the Ladder
In the Ladders Section of the Trade tab, you can see the Modify button when you click on the details of the Ladder. As you click Modify button, you will get 7 options to modify the Ladder
Add cash to ladder
Withdraw cash from ladder
Merge two ladders
Adjust ladder
Adjust step size
Adjust order size
Move funds to ladder
Detailed explanation is defined in the document Creating the Ladder
Stop Trading
In all the 5 sections of Ladders, you can see Stop Trading button in red colour at the top right side of the screen. By clicking this Stop Trading button, you can stop future trades. As soon as the stop trading process is finished, the Stop trading button disappears and two new buttons “Deactivate All the Ladders” and “Start Trading” are displayed.
User can use either buttons to carry on with trade.
After clicking Stop trading, the trading has successfully stopped. However if user wishes to withdraw the cash for his use, the ladder needs to be deactivated. And hence Deactivate Ladder button needs to be clicked.
Pease Note that Stop Trading button stops trading of all the active Ladders.
NAV
At the top left corner, NAV of your portfolio can be seen. By clicking on the double down arrow adjacent to the NAV, following parameters are displayed:
Position value
Unsold stocks cost
Unrealized profit
Realized profit
NAV
Unallocated cash
Cash needed for ladders
Extra cash left / generated
Cash for new ladders
Funds in play
Number of tickers
Active ladders
Inactive ladders
Trades
Orders
Simulation and Multiplier
In simulation (paper trading) options, User has the facility to simulate market conditions. For simulating the stock market prices, Two arrow buttons are provided. One green colour button with arrow pointing upwards is used to simulate market price upwards for that stock. By clicking this green button once, the stock price is simulated upwards with value equivalent to Step size.
And one red colour button with arrow pointing downwards is used to simulate market price downwards for that stock. By clicking this red button once, the stock price is simulated downwards with value equivalent to Step size.
User can click multiple times to simulate the market price of the stock to achieve the desired stock price level. However, if User wishes to use only one click to achieve the desired stock price, he can use Multiplier value to raise or lower the stock price in multiples of step size. By changing the multiplier value and then using the green and red buttons, User can increase or decrease respectively the simulated price of stock. Fraction values can also be entered in the Multiplier box.
User has the option to increase or decrease the stock price in simulation mode in multiples of step size. There is a multiplier icon at top row, below which a Box is provided where the value can be changed. By default the multiplier value is 1. By setting this value and then using the green colour button with arrow pointing upwards or red colour button with arrow pointing downwards User can simulate the stock prices and see the effect on his portfolio. Fraction of multiplier in the Multiplier box can also be entered.
For detail process on simulation please refer separate document.
Replicate and Reduce
As User clicks on the details of the Trades section, he will observe that a button (Replicate or Reduce) appears.
On clicking Replicate button, following options on the screen are provided for User to select. The purpose of this feature is provided for the User to do extra buying of the Stock at that Traded Market price and this shares bought can be configured to be sold at a sell price which can be decided, fixed and entered in the App. Automatic selling will happen at the fixed sell price of this selected number of stocks bought. This feature do not disturbs the present Ladder configuration and User can execute his buy and sell feature separately.
CSV File
11 A. Four individual CSV Files can be downloaded for each of the Sections in Trades Tab and they are
Ladder CSV
Order CSV
Position CSV
Activity CSV
11 B. Ladder CSV
Ladder CSV contains following data