Simulation paper trading is a method of practicing trading without risking real money, using “paper cash” or virtual funds. It involves creating a simulated environment that closely resembles live financial markets. This allows traders to execute buy and sell orders, build strategies, and manage portfolios without the financial consequences of real trading. One unique feature of simulation paper trading is the ability to manipulate or “simulate” stock prices within the simulation. This means traders can artificially change the price of a stock or other financial instruments at any time to test how specific strategies would perform under various market conditions.
For example, a trader can simulate a sudden price spike, a sharp decline, or prolonged stagnation to evaluate how their strategy reacts to such scenarios.
Steps to Use the Simulation Paper Trading
ENABLE SIMULATIOM MODE
Log in to the App
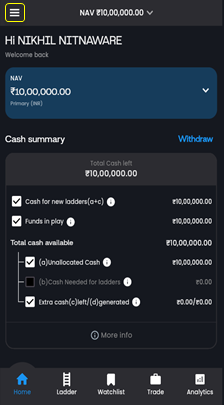
Upon logging into the app by entering your Email id and password, you will see an option to add paper cash to your account for demo purpose.
Enter your desired amount to set up your paper trading account balance.
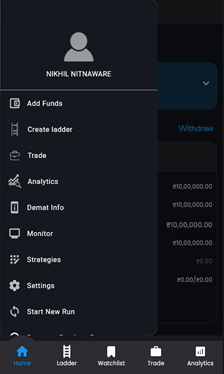
Access the Menu
Navigate to the top-left corner of the screen.
Click on the three horizontal lines to open the menu
Enable Simulation Mode
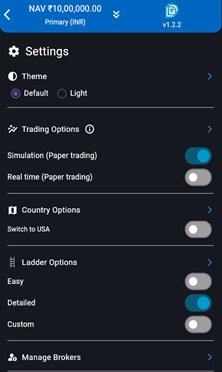
In the menu bar, click on the Settings button.
Select the first simulation mode: Simulation with Paper Trading.
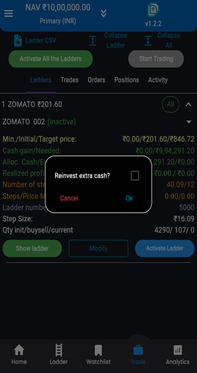
Here is the step where we need to activate our ladder to start trading
For start trading we first need to click on stock details and you will see on second screen activate ladder button is enabled.
By clicking on it pop up message will appear showed on the screen.
Which gives a option to reinvest extra cash if you want to reinvest click on check box if not click on ok to proceed
START SIMULATION TRADING
By clicking on the Start Trading button, your trading for the selected stock will start.
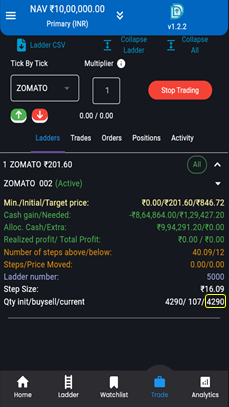
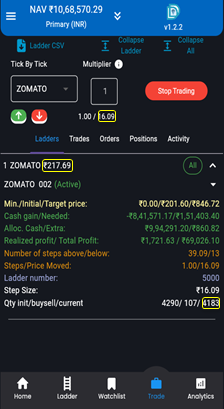
When you click the “Start Trading” button, your trading ladder is activated, and an initial buy order of 4290 shares at ₹201.60 per share is placed, totalling ₹864864 (4290 × ₹201.60). On the first screen, the stock quantity shows as 0, meaning no trades have been executed yet. Once the order is executed, the second screen reflects the updated quantity of 4290 shares, confirming that the order was successfully completed and the trade was processed.
INITIAL CHANGES IN TRADE, ORDER, POSITION AND ACTIVITY TAB
TRADES
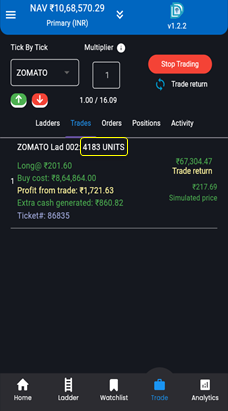
In the Trades section, the initial trade is recorded once it is executed at the initial buy price 201.60, showing the details of your first executed transaction. This section provides a quick view of all trades that have been completed, starting with your initial trade of 4290units with buying cost at 864864rs.
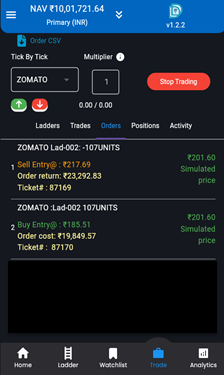
ORDERS
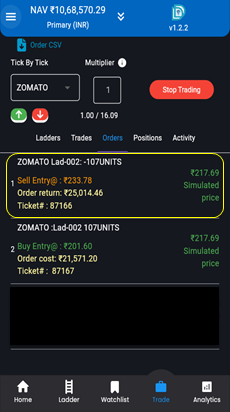
Next, in the Orders section, you’ll notice two pending orders: one for a sell entry and one for a buy entry. These orders will not executed immediately, as they depend on the price movements. As you simulate the price moving up or down, these pending orders get triggered first then buy or sell entry will be executed, depending on the price direction. Once an order is executed, a new order for the next buy or sell entry will automatically appears in orders section, ensuring your trading strategy.
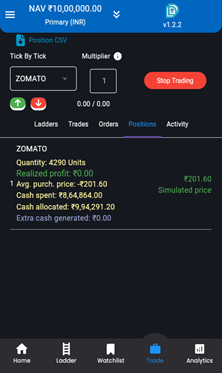
POSITION
Moving to the next screen, the Position section provides an overview of your overall portfolio. Here, you can view key details about your stocks, including the INITIAL quantity held, realized profit, average purchase price, and any extra cash generated. This section allows you to evaluate your stock performance comprehensively, helping you make informed investment decisions.
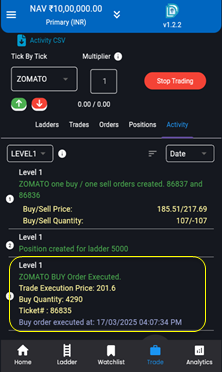
Activity
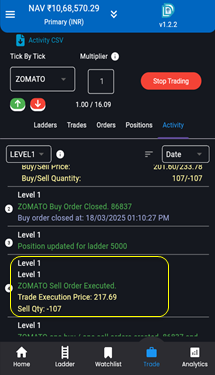
The Activity section tracks all the actions related to your trading. This includes orders that are actively being placed, or executed, such as buy or sell order. So here in the activity section you can clearly see that your initial order has been successfully executed at initial buy price.
SIMULATE PRICE UP
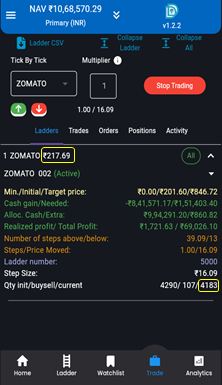
Here as we simulate a price increase by clicking on the GREENARROW BUTTON to observe the potential changes across the following sections
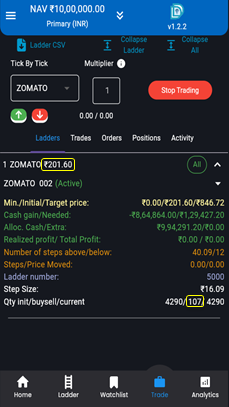
So if we have a look On the first screen shown, when you click on the green arrow button, it initiates a change in the price, INCREASES from (201.60 TO 217.69 AS THE STEP SIZE IS 16.09) and same reflected on the second screen. Specifically, the stock price increased by a defined step size. This price reduction triggers the execution of a sell order, resulting in an decrease in the total number of shares. The quantity of shares sold is determined by a predefined value i.e (107QTY), and the updated share count which is (4290-107=4183) is displayed on the second screen highlighted with yellow box.
CHANGES AFTER SIMULATE PRICE UP
Here are the changes you can observe across four different screens.
TRADES
Now, moving to the trades section, you can review the executed trades. As mentioned on the previous screen, when the price increases, the sell order is triggered. As a result, the quantity of shares sold is subtracted from the initial quantity. For example, if the initial quantity was 4290 and shares were sold, the updated quantity would be (4290 – 107) = 4183. This updated quantity is displayed on the screen, highlighted with a yellow box.
ORDERS Moving to orders section as we simulate the price up sell order been executed and new sell entry will automatically appear in the order section.
POSITION
This section reflects the updated quantity of holdings, along with details of your realized profits and extra cash generated from the trades.
ACTIVITY
In the activity section, you can view the successful execution of your SELL order highlighted with yellow box. It provides detailed information, including the execution price and the quantity of shares sold.
SIMULATE PRICE DOWN
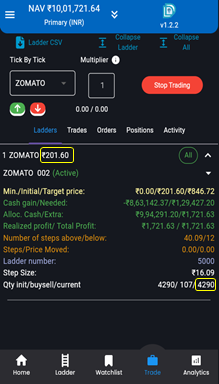
Now Begin the simulation by clicking the RED ARROW button to reduce the price. This will start the process and display the effects of the price change
Observing the first screen shown, when you click the RED ARROW button, it initiates a change in the price, DECREASES from (217.69 TO 201.60 AS THE STEP SIZE IS 16.09) and same reflected on the second screen. Specifically, the stock price decreases by a defined step size. This price reduction triggers the execution of a buy order, resulting in an increase in the total number of shares. The quantity of shares bought is determined by a predefined value i.e (107qty), and the updated share count which is (4183+107=4290) is displayed on the second screen highlighted with yellow box.
CHANGER AFTER SIMULATE PRICE DOWN
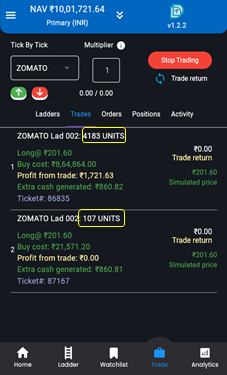
1. Trade Section:
In the trade section, you can clearly see your recent trades placed as the price decreased. As you simulate the price moving down, your new trade i.e BUY entry will appear. These trades are highlighted within a yellow box for easy identification. Moreover, when you sum the quantities of both trades (4183+107 = 4290) it will give you the total quantity, this total quantity will updated and also be displayed in the position section.
2. Orders Section:
The orders section automatically updates to display next buy and sell entries. These new entries appears as soon as one of the earlier buy or sell order executed.
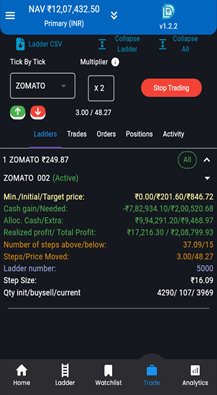
MULTIPLIER
The Multiplier feature allows you to dynamically adjust your step size by multiplying it with a value you select. This gives you the flexibility to increase or decrease the step size based on your preferences. For instance, if your original step size is 10 and you apply a multiplier of 2, the step size becomes 20. With this feature, you can easily tune the step size to optimize your experience.
On the screen, I begin by simulating the price up with a step size of 16.09 and a multiplier of 1. The stock price changes from 201.60 to 217.69. This is calculated as:
Next, I adjust the multiplier to 2 and simulate the price up again. This time, the stock price increases from 217.69 to 249.87. Here, the step size is doubled (Step Size × Multiplier = 16.09 × 2 = 32.18), and the new price is calculated as:
217.69 + 32.18 = 249.87
This demonstrates how the Multiplier feature dynamically adjusts the step size, offering precise control over price changes in both upward and downward simulations. All actions are logged for better tracking and analysis.